
Please refer to important disclosures at the end of this report
1
Muthoot Finance
Gold at ‘work’
IPO Note
|
Banking
April 18, 2011
Organized gold lending - a fast-growing and highly profitable niche:
Organized gold loan NBFCs have grown at a tremendous rate of 76.2% CAGR
over FY2007-10 and a reasonably large potential market still remains, considering:
a) even as of FY2010, ~75% of the total market is with the unorganized money
lenders and pawnshops (Source: RHP, CRISIL), b) relatively lower rates of interest
and higher trust factor than unorganized players, c) increasing reach due to rapid
branch expansion, d) fast and convenient service and e) increasing acceptability of
gold loans aided by heavy advertising. Further, as of FY2010 only ~4.7% of India’s
gold holding is pledged for gold loans, highlighting further potential for future
growth. Moreover, small-ticket gold loans are a highly profitable niche, as the
target market for gold loan NBFCs are mainly un-banked customers and credit
costs are also low due to the gold collateral.
Leading organized player with proven track record: Muthoot Finance Ltd.
(MFL) has capitalized on this opportunity, growing its AUM at 93.8% CAGR over
FY2008-8MFY2011 (~20% organized market share as of FY2010 as per IMaCS
Industry Report). This growth has been underpinned by a strong branch network
through rapid expansion (56.5% CAGR over FY2008-11MFY2011), a strong and
trusted brand which has enabled swift customer acquisition, fast and convenient
service and relatively more flexible products than banks.
Outlook and Valuation: While gold loan NBFCs like MFL have seen highly
profitable growth so far, this has occurred in an environment of consistently rising
gold prices. Any sharp decline in gold prices could pose downside risks to growth
and asset quality. Moreover, recent developments regarding lending to relatively
low-income segments have highlighted regulatory risks to MFL’s business from
any regulatory capping of its currently high yields (~19% in 8MFY2011). That
said, post-correction, MFL’s closest competitor Manappuram (MGF) is trading at
1.8x FY2013E BV (Bloomberg consensus) and MFL has been priced equivalent to
MGF’s valuations at the upper end of the price band. Considering the reasonably
high growth potential and profitability, we expect moderate upsides at the upper
band, also taking into account MFL’s higher market share than MGF, better
operating efficiency, higher leverage and a more extensive pan India branch
network. Hence we recommend a Subscribe to the issue at the upper price band.
Key financials
Y/E March (` cr) FY2010 FY2011E
FY2012E
FY2013E
NII
604 1,173
1,831
2,196
% chg
103.6
94.4
56.0
19.9
Net profit
229 471
777
906
% chg
133.5
105.9
65.1
16.6
NIM (%)*
11.1 10.0
9.3
8.2
EPS (`)
7.6 14.7
20.9
24.4
P/E (x)
#
23.1 11.9
8.4
7.2
P/ABV (x)
#
9.4 4.4
2.3
1.8
RoA (%)*
3.5 3.6
3.5
3.0
RoE (%)
48.3 49.7
36.5
26.9
Source: RHP, Angel Research. Note:
#
Valuations at the upper price band, *Calculated on total
assets includin
g
bilateral assi
g
nments
SUBSCRIBE
Issue Open: April18, 2011
Issue Close: April 21, 2011
Issue Details
Face Value: `10
Present Eq. Paid-up Capital: `320.2cr
Offer Size: 5.15cr Shares
Post Eq. Paid-up Capital: `371.7cr
Issue size (amount):** `824-901cr
Price Band: `160-175
Post-issue implied mkt cap**: `5,947cr-
6,505cr
Promoters holding Pre-Issue: 93%
Promoters holding Post-Issue: 80.1%
Note: **At the lower and u
p
per price band,
respectively
Book Building
QIBs Up to 50%
Non-Institutional At least 15%
Retail At least 35%
Post Issue Shareholding Pattern
Promoters Group 80.1
MF/Banks/Indian
FIs/FIIs/Public & Others
19.9
Vaibhav Agrawal
022 – 3935 7800 Ext: 6808
Shrinivas Bhutda
022 – 3935 7800 Ext: 6845
Varun Varma
022 – 3935 7800 Ext: 6847
Muthoot Finance
|
IPO Note
A
pril 18, 2011
2
Company background
MFL is India’s largest gold financing company (as of FY2010) in terms of loan
portfolio, as per IMaCS Industry Report. MFL is a Systemically Important Non-deposit
taking NBFC (NBFC-ND-SI) engaged in providing personal and business loans
secured by gold jewelry, primarily to individuals who possess gold jewelry but do not
have access formal credit within a reasonable time, or to whom credit may not be
available at all, to meet unanticipated or other short-term liquidity requirements.
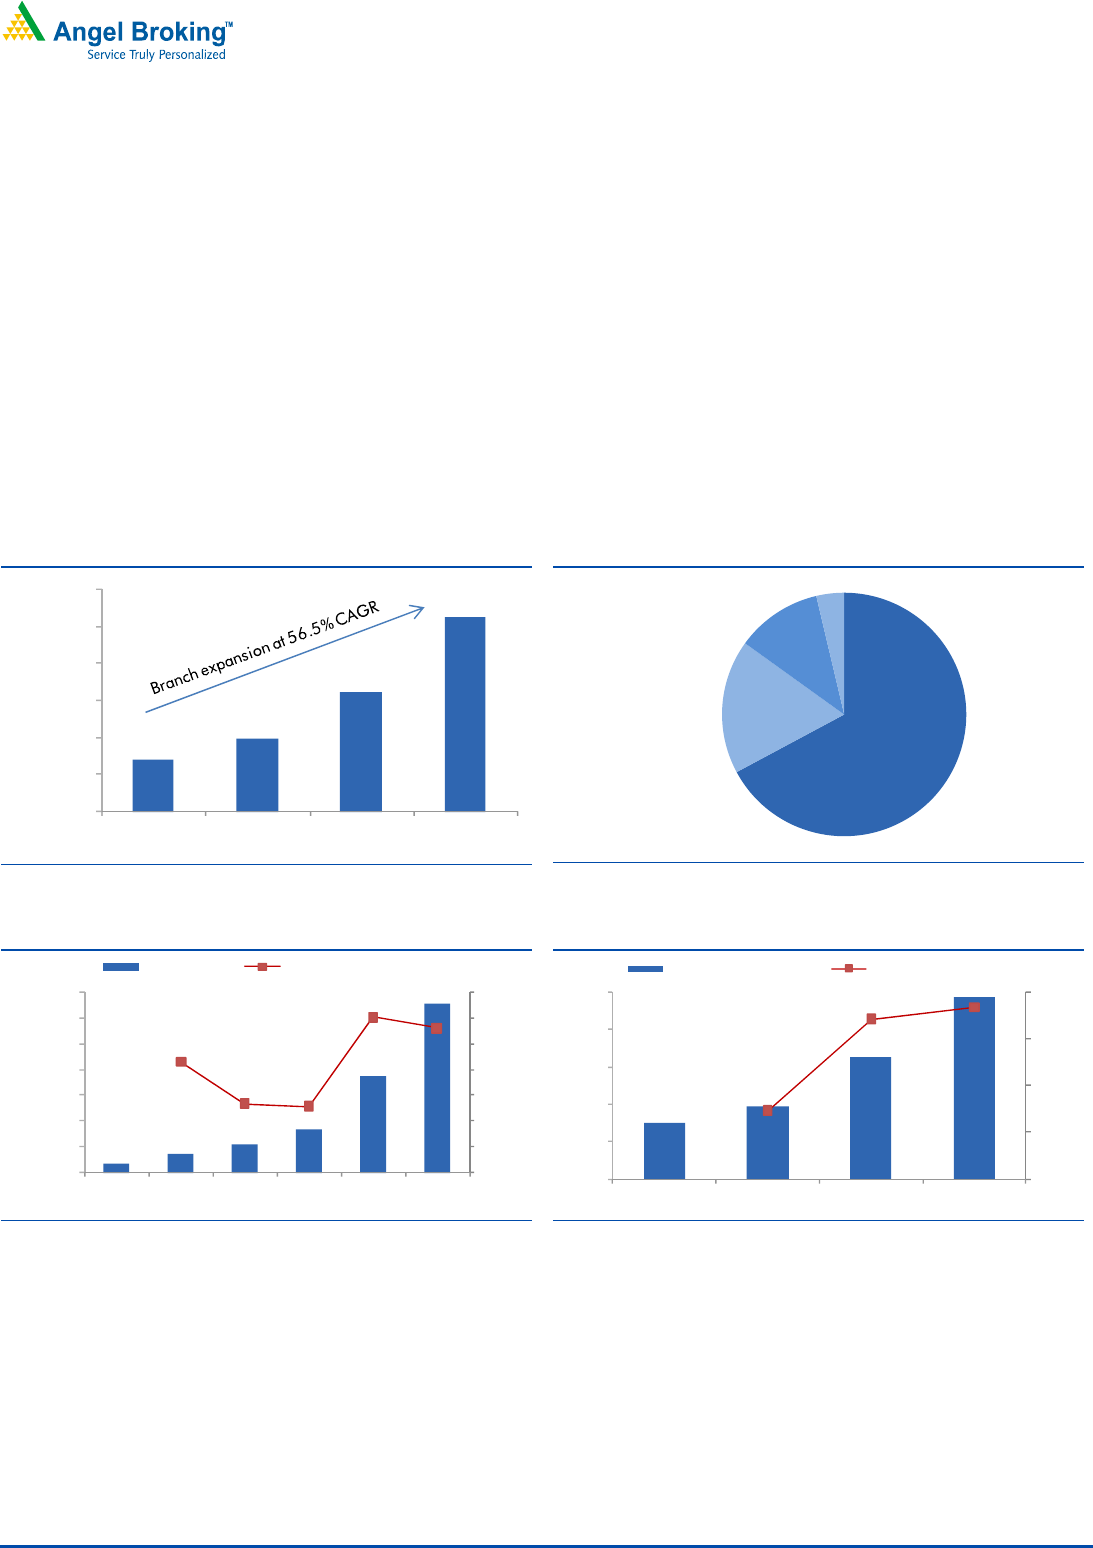
According to the IMaCS Industry Report, as of FY2010 MFL’s branch network of
1,605 branches was the largest among gold loan NBFCs in India. The branch
network has been expanded to 2,611 branches as of February 2011 (it has further
grown to 2,749 branches as of April 15, 2011 as per MFL website). MFL has a
strong customer base as evident in ~4.1 million loan accounts as of 8MFY2011.
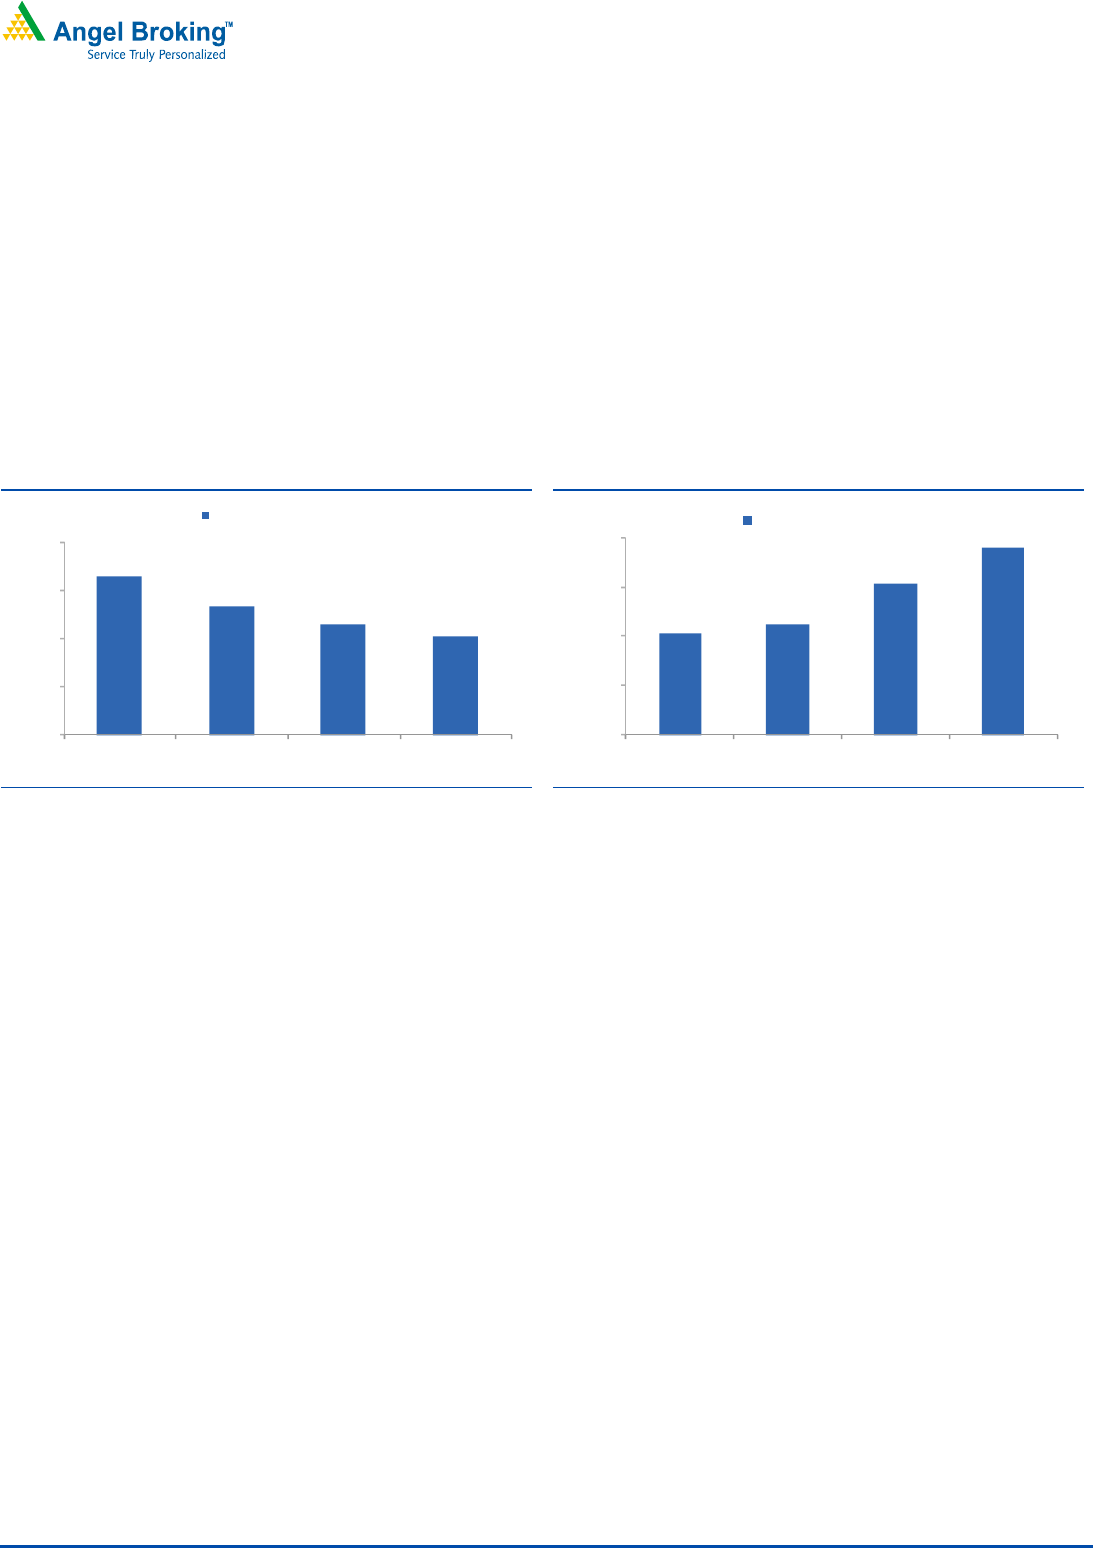
Exhibit 1: Rapid Branch Expansion
707
985
1,605
2,611
-
500
1,000
1,500
2,000
2,500
3,000
FY2008 FY2009 FY2010 11MFY11
No of Branches
Source: RHP, Angel Research
Exhibit 2: Strong branch network in Southern India
Southern India
67%
Northern India
18%
Western India
11%
Eastern India
4%
Source: RHP, Angel Research
Exhibit 3: Strong AuM growth over past 2 years…
780
1,451
2,226
3,369
7,438
13,004
86
53
51
121
112
-
20
40
60
80
100
120
140
-
2,000
4,000
6,000
8,000
10,000
12,000
14,000
FY2006 FY2007 FY2008 FY2009 FY2010 8MFY11*
AuM (` cr) YoY growth (%,RHS)
Source: RHP, Angel Research; Note: growth for 8MFY11 annualized
Exhibit 4: …led primarily by volume growth
30 39 66 98
29.2
68.4
73.5
0
20
40
60
80
-
20
40
60
80
100
FY2008 FY2009 FY2010 8MFY11*
Gold volume (Tonnes) YoY growth (%,RHS)
Source: RHP, Angel Research; Note: growth for 8MFY11 annualized
Details of the issue
The IPO comprises an issue of 5.15cr equity shares of face value of `10 each in
the price band of `160–175 per share. The company expects to raise between
`824cr and `901cr at the lower and upper price band, respectively. The primary
issue of shares would result in a dilution of the promoter’s holding by 12.88% to
80.12%. The issue proceeds are planned to be utilized for augmenting the capital
base to meet future capital requirements, to provide for funding of loans to
borrowers; and for general corporate purposes.
Muthoot Finance
|
IPO Note
A
pril 18, 2011
3
Organized gold lending - a fast-growing and highly
profitable niche
Indian gold loan market – an overview
Indian gold loan market has historically been predominantly controlled by the
unorganized sector (accounting for ~75% of the total market according to the
IMaCS Industry Report as of FY2010) comprising of local money lenders and
pawnshops, which is highly fragmented, charge exorbitant rates, and often carry a
social stigma associated with borrowing from them. The competitive edge for
lenders in the unorganized sector lies in their ability to provide funds with
minimum documentation, quick and hassle-free disbursement of loans.
The gold loan market in India is under-penetrated considering the abundant
availability of gold as collateral with Indian private households (~17,500 tons or
10% of world’s gold stock, according to the World Gold Council (WGC), valued at
over `27,40,000cr as of FY2010) and the existing size of the gold loan market
(~`37,500cr for organized sector and ~`1,12,500cr for unorganized sector).
Further Indian households add ~700 tons to this holding each year of which
~75% is in the form of jewelry and this is expected to rise to ~1,200 tons by
CY2020 according to the WGC. However, this penetration data has to be
considered in the context of the likely concentration of gold holdings with high net
worth individuals, perception of it being the last resort financing and the social
stigma often attached to gold loans.
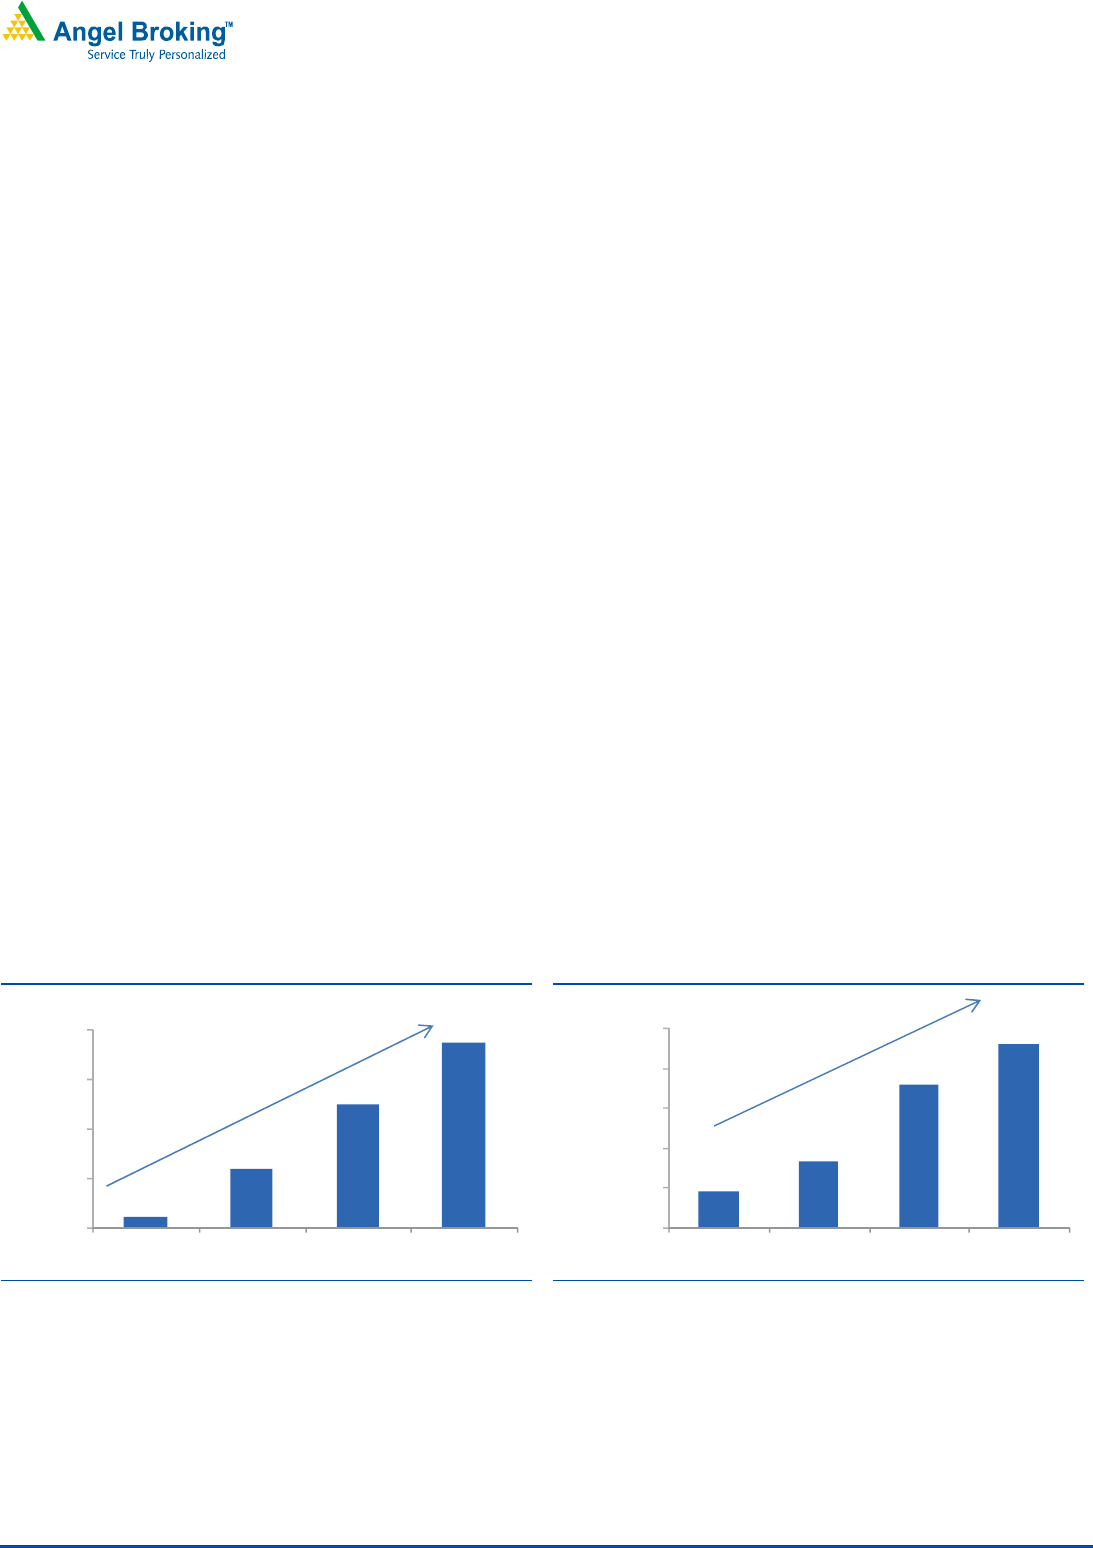
According to the IMaCS industry report, organised gold loan market size has
grown significantly over the past decade growing at a healthy CAGR of ~40.3%
during FY2002-FY2010 and has gained further momentum with CAGR of 46.2%
during FY2007-FY2010 to ~`37,500cr. During this period, growth in NBFCs was
much higher at 72% while the portfolio of MFL grew at a CAGR of 73%.
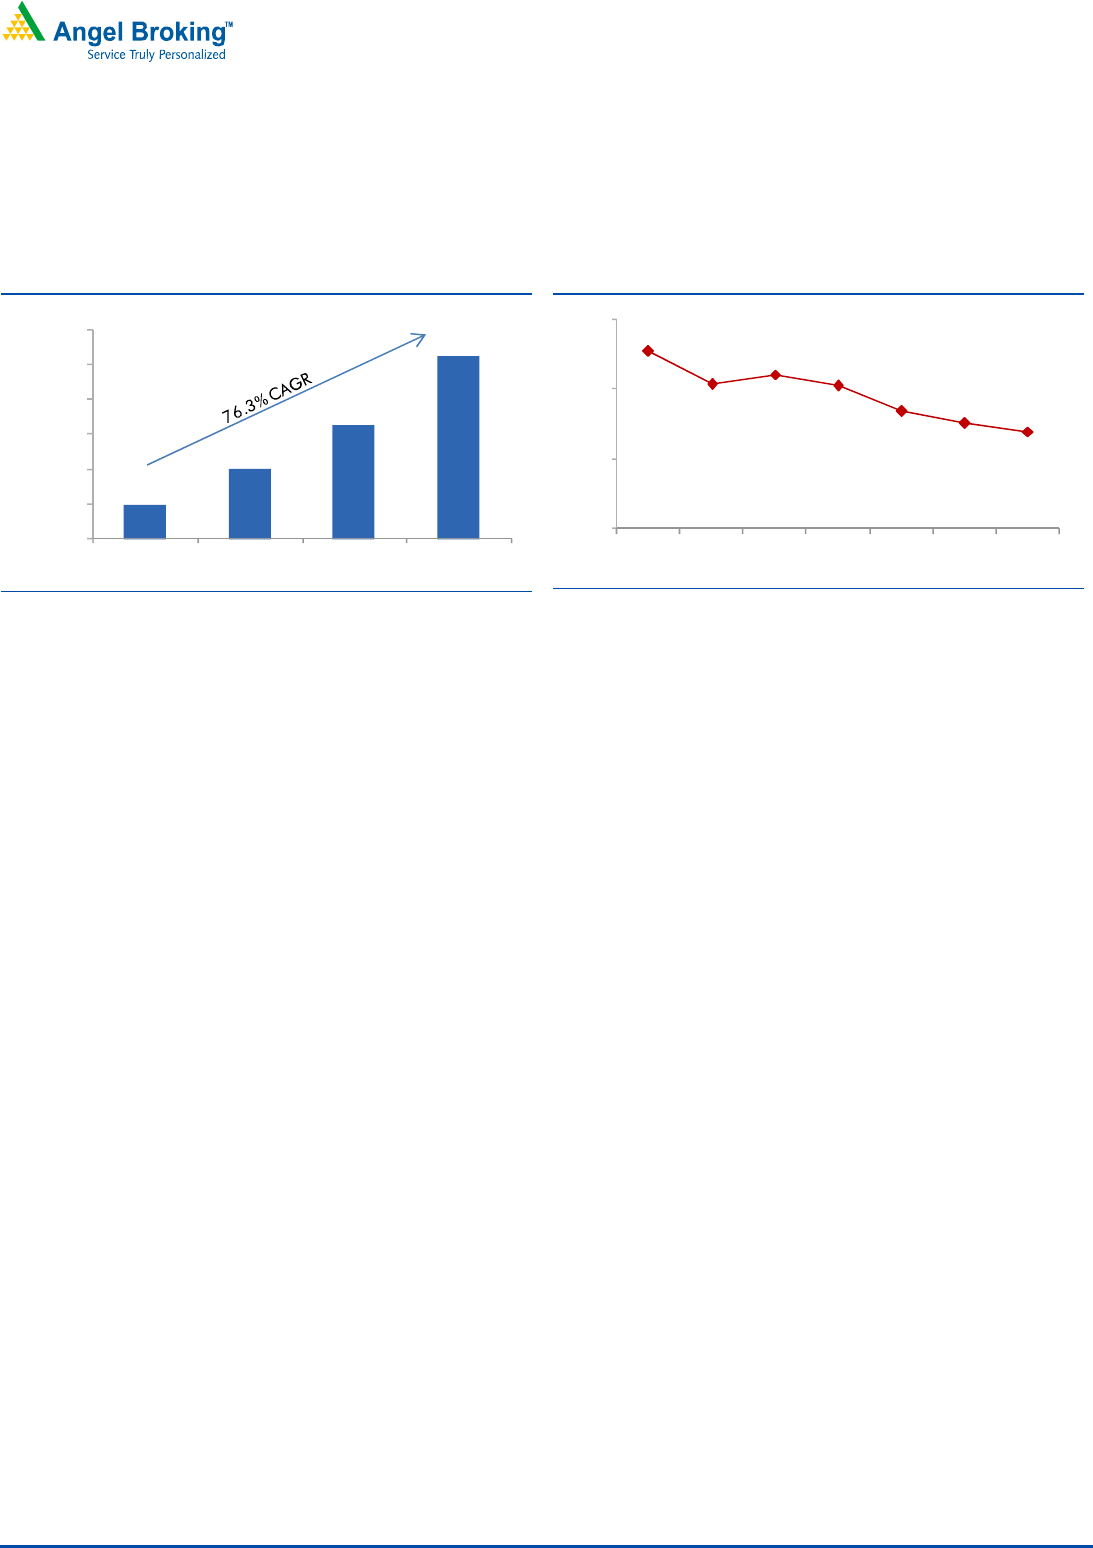
Exhibit 5: Size of organized gold loans market in India
2,500
12,000
25,000
37,500
-
10,000
20,000
30,000
40,000
FY2002 FY2007 FY2009 FY2010
40.3% CAGR
(` cr)
Source: RHP, Angel Research
Exhibit 6: Value of Gold Stock
646,200
1,166,900
2,500,000
3,200,000
-
700,000
1,400,000
2,100,000
2,800,000
3,500,000
FY2002 FY2007 FY2009 FY2010
22.1% CAGR
(` cr)
Source: RHP, Angel Research
NBFCs such as MFL enjoy the highest credit rating from both CRISIL and ICRA for
their short-term debt (AA- rating for long term debt) which enables them to borrow
funds at highly competitive rates and price their lending aggressively compared to
the unorganized sector.
Over the past few years, the organized sector led primarily by the gold loan NBFCs
have grown their market share on the back of a) relatively lower rates of interest

Muthoot Finance
|
IPO Note
A
pril 18, 2011
4
and higher trust factor than unorganized players, b) increasing reach due to rapid
branch expansion, c) fast and convenient service and d) increasing acceptability of
gold loans aided by heavy advertising.
Relatively higher yields
MFL is able to command relatively higher yields as compared to banks due to the
convenience factor. NBFCs like MFL offer flexibility, quick disbursal with minimal
documentation to their customers in return for a premium on the rates of interest
charged. The loan-to-value (LTV) ratio for 22 carat jewelry typically varies from
55-65% by banks while it varies from 70-80% by NBFCs, which may be further
adjusted subject to the purity of gold; this increases the attractiveness of borrowing
from NBFCs compared to banks. As indicated by the management MFL does not
charge any prepayment charges and calculation of interest is also done on the
basis of number of days for which the loan was outstanding, these options offer
flexibility to customers and increase relative appeal of their loan product.
MFLs loan processing time is 5-10 minutes as it relies on its own staff for
verification of purity and weight of gold jewelry. As the customers of MFL are
mainly from lower and lower middle income groups and the loans are usually
taken as bridge financing, the processing time is of paramount importance for the
customers for which they generally do not mind shelling out extra interest. MFLs
average yield on advances is ~20% p.a. compared to ~13% p.a. for banks.
Though the term of loans is 12 months most of the loans get run down in
4-5 months and the average ticket size is just ~`31,500. Hence the extra interest
burden works out to just ~`700-800 which the customers do not mind paying
given the criticality of time. Further the rates charged by MFL are lower than those
charged by the local unorganized moneylenders.
Low credit risks
On the asset quality front, loans given out are over collateralized by a) average
LTV in the lower 70s and b) appraisal of gold jewelry on the basis of scrap value
by ignoring the making charges of the jewelry as well as the weight of precious
stones studded in the jewelry. In addition to this MFL lends only against household
gold jewelry (at or above 20 carat purity only) and not against gold bars. The
household jewelry generally has an emotional and sentimental value attached as it
is generally passed on from generations to generations; this ensures that the loan
is repaid at the first opportunity resulting in minimal credit risks.
Even if a borrower defaults, MFL possesses adequate documentary support for
auctioning the gold collateral in which, according to the management, it has
historically never lost any portion of the principal and has been able to secure
around one-third of the interest income accrued on the loan. This has ensured that
the level of NPAs has been contained at the bare minimum as evident from the
fact that as of November 30, 2010, MFL had a gross NPA ratio of 0.4% and it has
been contained within 0.5% in each of the past three years. Even this NPA level
could have been brought down to zero by selling the pledged jewelry but to ensure
future business and as a good business measure, MFL has been giving an
extension to certain borrowers for 2-3 months beyond the repayment date.
Muthoot Finance
|
IPO Note
A
pril 18, 2011
5
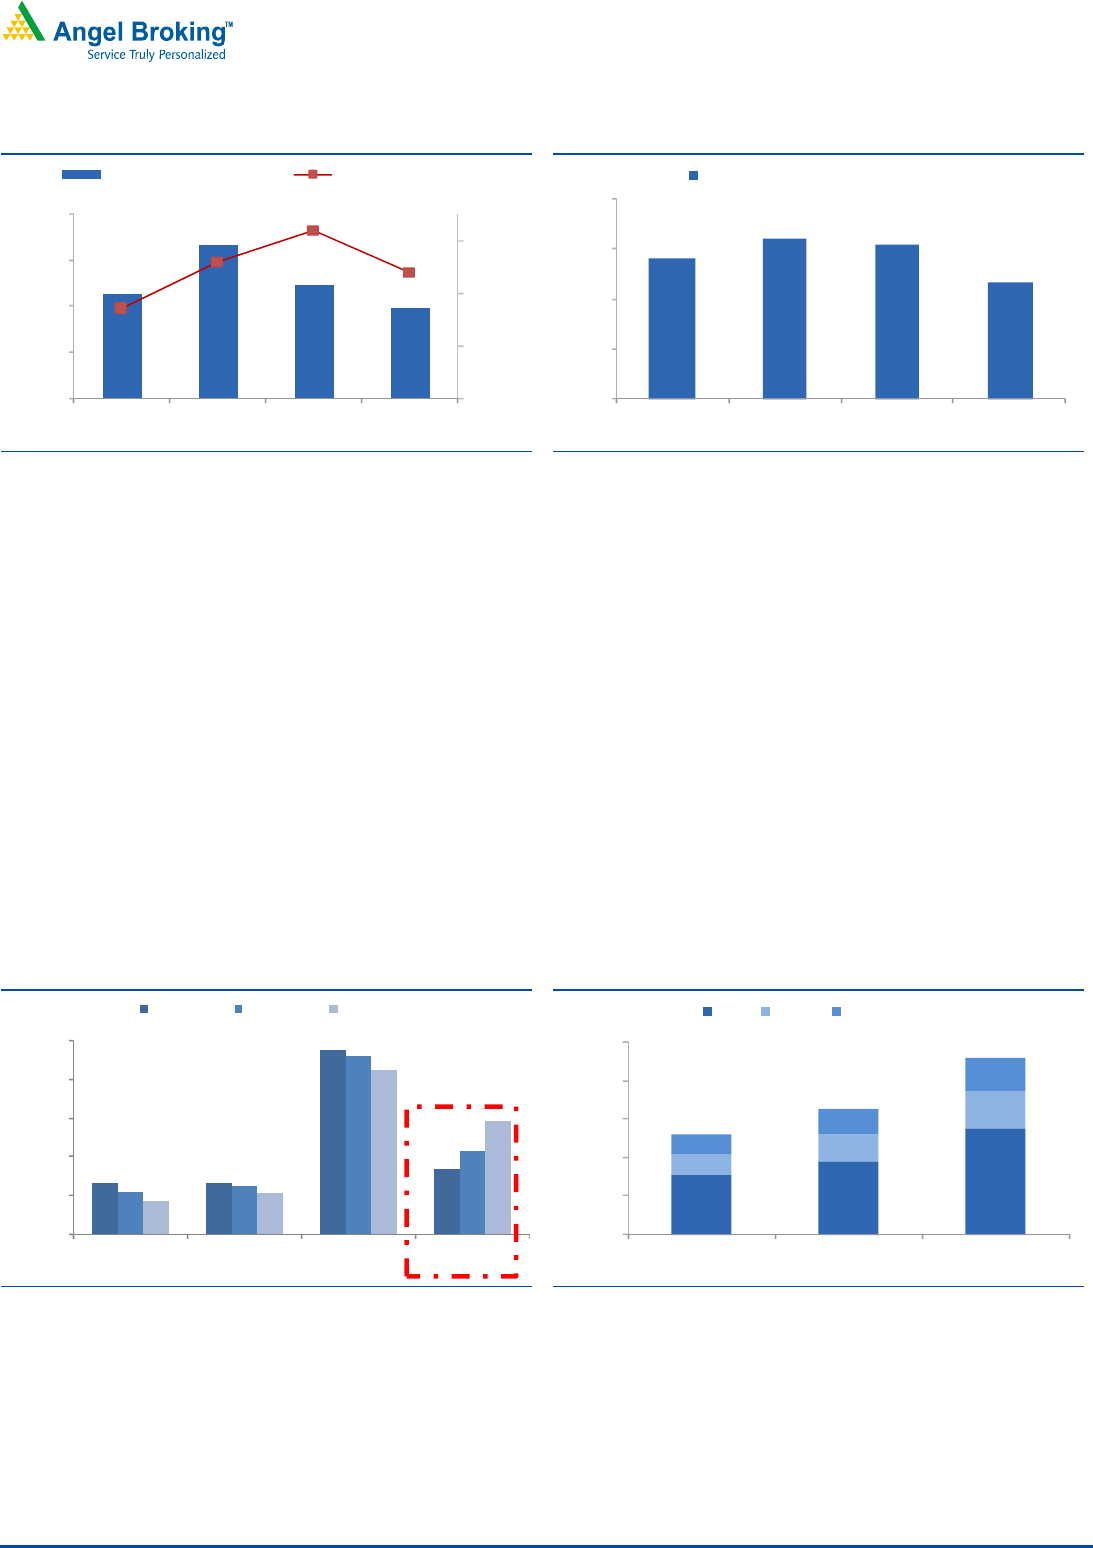
Exhibit 7: NIM moderating due to declining yields
19.5 21.7 19.9 18.9
9.7
10.6
11.2
10.4
8.0
9.0
10.0
11.0
15.0
17.0
19.0
21.0
23.0
FY2008 FY2009 FY2010 8MFY11
Yield on Advances (%) Reported NIM (%, RHS)
Source: RHP, Angel Research
Exhibit 8: Low credit risks
0.42
0.48
0.46
0.35
0.00
0.15
0.30
0.45
0.60
FY2008 FY2009 FY2010 8MFY11
Gross NPAs/Gross Retail Loans (%)
Source: RHP, Angel Research
Strong market share gains
According to the IMaCS Industry Report, the market share of NBFCs in gold loans
has risen from 18.4% in FY2007 to 32.2% in FY2010, at a healthy CAGR of 20.5%
while banks both PSU and private sector banks have lost market share from 52.3%
to 46.5% and from 14.8% to 11.6%, respectively over the same period.
Among the gold loan NBFCs, MFL has continued to be a dominant leader
enjoying ~60% of market share of NBFCs and ~20% (up from ~11% in FY2007)
of the organized gold loan industry (as of FY2010). This healthy growth has been
brought about by focused approach and rapid branch network expansion (42.8%
CAGR over FY2007-10). The pace of branch expansion has been further
accentuated in the 11MFY2011 to 63%, taking the network from 1,605 branches
as of FY10 to over 2,600 branches as of February 2011. This strong branch
expansion is expected to lead to further market share gains for MFL as the
customers generally prefer to transact at the nearest branch.
Exhibit 9: NBFCs capturing the market share...
14.5
14.8
52.3
18.4
12.1
13.7
50.6
23.6
9.7
11.6
46.5
32.2
-
11.0
22.0
33.0
44.0
55.0
Co-operatives Pvt Sector Banks PSU Banks NBFCs
FY2007 FY2009 FY2010
(%)
Source: RHP, Angel Research
Exhibit 10: ...led by MFL
11.0
13.4
19.5
3.7
4.9
6.8
3.6
4.8
5.9
-
7.0
14.0
21.0
28.0
35.0
FY2007 FY2009 FY2010
MFL MGFL Muthoot Fincorp
(%)
Source: RHP, Angel Research
The total gold loan AUM (including assignment of receivables) of MFL has
increased from `780cr to `13,004cr at a staggering CAGR of 82.7% over
FY2006-8MFY2011 on the back of 47% CAGR in the number of branches (551 in
FY2007, 2,263 in 8MFY2011). The increase in branch penetration has led to the
AUM per branch increasing from `2.63cr to `5.75cr over the same period.
Muthoot Finance
|
IPO Note
A
pril 18, 2011
6
Competitive strengths
The success of MFL in gold financing has been a play of various competitive
strengths that the company has developed since its inception. A large branch
network of 2,611 branches ably supported by high quality customer service has
created a strong brand image. The company also runs training centers to train
new employees in appraisal skills, customer relations and communication skills. As
the asset quality is critically based on the sanctity of the purity and weight
verification process, MFL has set up training centers for building a talent pool to
enable the company to staff new branches with qualified and skilled personnel.
The training has also helped in shortening the turnaround time for loan disbursals.
Loan of an average ticket size is appraised and disbursed in under 5 minutes by
the company. Quick disbursal with minimal documentation provides a competitive
edge against commercial banks that provide gold loans.
Capital adequacy to be strengthened further post IPO
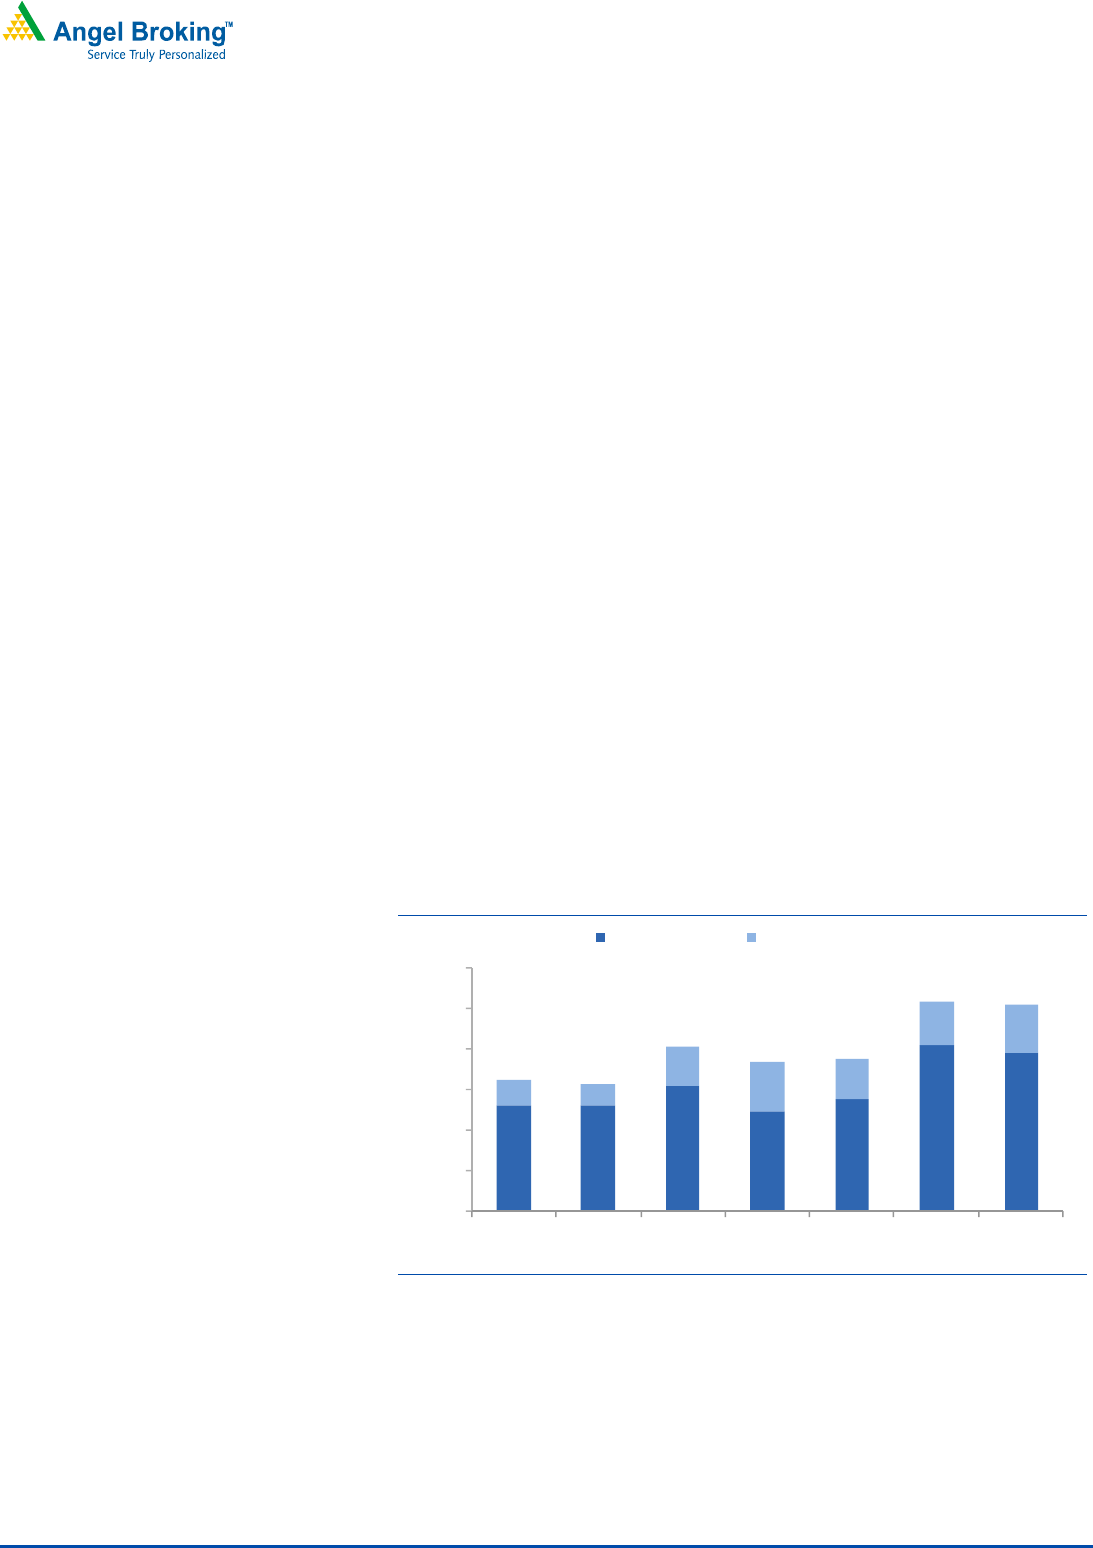
Post IPO, MFL will be well positioned for the next phase of growth. As of
9MFY2011, the CRAR stood at 15.2% with a Tier- I CRAR of 10.7%. Post capital
infusion though the IPO, the Tier-I ratio is expected to jump to ~21% compared to
the mandatory requirement of 15% by the Reserve Bank of India, making the
company well-capitalized to increase its gold AUM at a CAGR of 37.3% in
FY2011E-FY2013E. The risk-weightage prescribed by the RBI on loans against
gold given out by NBFCs is 100% while for the gold loans for agri disbursed by
banks is only 50%. If this apparent regulatory inconsistency is normalized in the
future, gold financing NBFCs are expected to grow even faster and is likely to lead
to aggressive market share gains for them.
Exhibit 11: Well positioned for the next phase of growth
10.5
10.6
12.5
9.9
11.1
16.5
15.7
2.6
2.0
3.8
4.9
4.0
4.3
4.8
13.1
12.6
16.3
14.8
15.1
20.8
20.5
0.0
4.0
8.0
12.0
16.0
20.0
24.0
FY07 FY08 FY09 FY10 FY11E FY12E FY13E
Tier 1 CAR (%) Tier 2 CAR (%)
S
ource: RHP, Angel Research
Aggressive expansion into other regions to reduce concentration
risks
As most of India’s gold holding is concentrated in south India (~40%), 75.4% of
AUM for MFL comes from the southern region. While the gold holdings are
relatively lower in western and northern regions (~25% each), the combined AUM
in these regions is just above 22%, highlighting the cultural averseness in pledging
Muthoot Finance
|
IPO Note
A
pril 18, 2011
7
gold. With the southern market also being heavily competed for by other major
market players such as MGF, IOB and Indian Bank, MFL has been aggressively
expanding in northern and western regions. During FY2008-11MFY2011, the
company opened 409 branches in the northern region (106.6% CAGR) and 256
branches in the western region (97.2% CAGR). The AUM over FY2008-8MFY2011
grew by 98.4% CAGR in the northern region to 1,811cr and 146.6% CAGR in the
western region to `1,036cr. The company opened 1,151 branches in the southern
region in FY2008-11MFY2011 at 44.3% CAGR leading to a more than double
89.0% CAGR growth in AUM to `9,709cr, highlighting the importance of brand
building in attaining higher branch penetration and the potential to do the same in
the other regions of India.
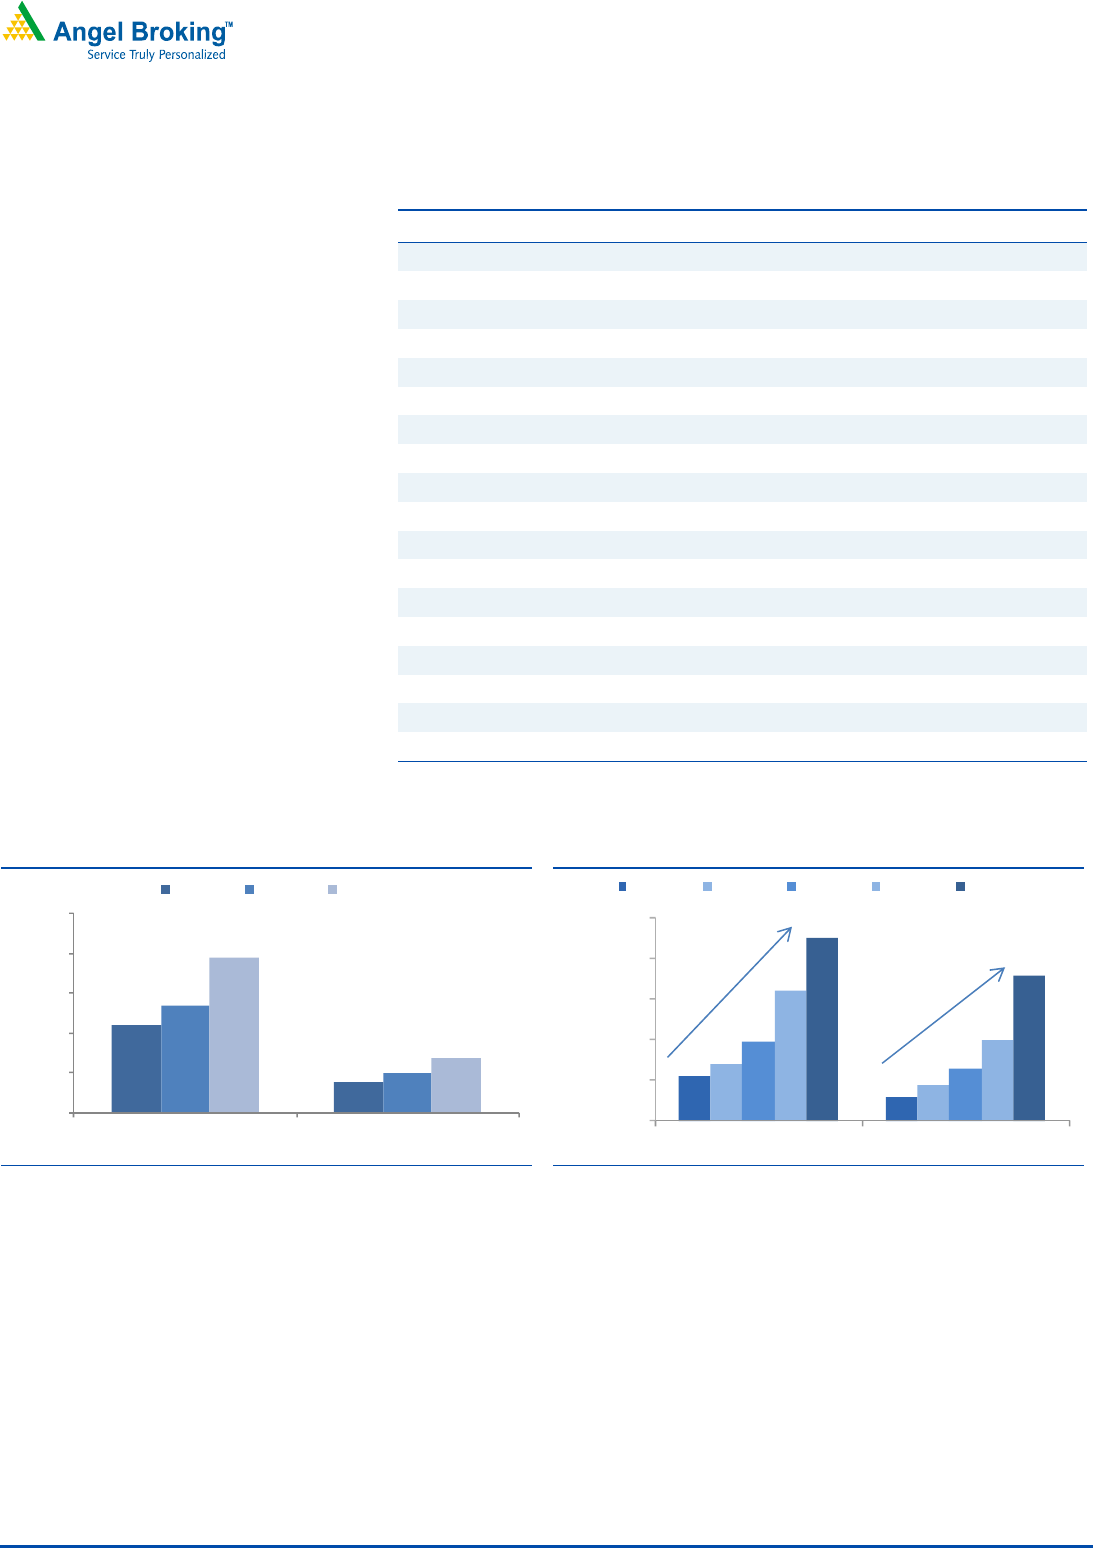
Exhibit 12: Region-wise AUM per Branch (FY2010)
4.9
4.0
3.5
3.1
-
1.5
3.0
4.5
6.0
Southern India Northern India Western India Eastern India
AuM/Branch (` cr)
Source: RHP, Angel Research
Exhibit 13: Optimisation of branch network
3.1
3.4
4.6
5.7
-
1.5
3.0
4.5
6.0
FY2008 FY2009 FY2010 8MFY11
AuM/Branch (` cr)
Source: RHP, Angel Research
While MFL’s branches and consequently business have been concentrated in the
southern region, the management has aggressively expanded into all the three
remaining regions over the past 3 years with a view to reduce the concentration
risks and grab the opportunities in the other regions as well. MFL has opened
~40% of the incremental branches during FY2008-11MFY2011 in the northern,
western and eastern region which accounted for just 15% of the total branch
network as of FY2008. As a result, proportion of southern region in the
incremental loans during FY2008-8MFY2011 has reduced to ~74% from over
82% of the total loan book as of FY2008.
MFL has grabbed the first mover advantage primarily in the northern region with
setting up of 548 branches (~20% of total branch network) compared to just
177 branches (~9% of total branch network) of MGF in the northern region. This
aggressive expansion into other regions is expected to help the company to reduce
the dependence on the southern region and open up further growth avenues for
MFL, going forward.
Better operating efficiency compared to MGF
Operating costs for gold financing NBFCs are high given the granularity of the
disbursals (average ticket size of ~`31,500). Gold financing NBFC is a
labour-intensive business requiring recruitment at large scale. In the month of
February, 2011, MFL served an average of ~68,000 customers per day through
its extensive network of 2,611 branches and an employee base of over 15,600
employees. However amongst MFL and MGF, MFL enjoys a competitive edge with
Muthoot Finance
|
IPO Note
A
pril 18, 2011
8
operating costs to average assets ratio of 4.1% compared to MGF’s 6.2% during
FY10. Even these are expected to normalize downward, as the business
starts reaping benefits of economies of scale and provide some cushion against
falling yields.
Exhibit 14: Strong increase in employee base
2,999
5,979
9,745
15,664
-
3,000
6,000
9,000
12,000
15,000
18,000
FY2008 FY2009 FY2010 11MFY11
Source: RHP, Angel Research
Exhibit 15: Operating efficiency to continue
5.1
4.2
4.4
4.1
3.4
3.0
2.8
0.0
2.0
4.0
6.0
FY07 FY08 FY09 FY10 FY11E FY12E FY13E
Note: RHP, Angel Research; Note: Opex to avg. assets (%) incl. bilateral assignments
Investment concerns
Regulatory risks
Since the entire model of NBFCs is relatively new to the Indian economy,
regulations concerning them have changed frequently and are bound to do so in
the near future. The agri-gold loans given by banks to gold loan financing NBFCs
by purchasing their receivables, until recently were accorded agricultural priority
sector status. However, on February 3, 2011 the Reserve Bank of India has
removed this status leading to a likely negative impact on the entire sectors
profitability. The priority sector funds used to come at a cost of ~200bps lower
than normal bank borrowings. Although the major source of funding for MFL is
working capital loans (38% as of FY2010) and proceeds from issuance of Non
Convertible Debentures also known as Muthoot gold bonds (27% as of FY2010),
borrowings by assigning receivables also contributes significantly to the funding
mix (26% as of FY2010). Taking into account the normal bank borrowings that
would also be affected by this rule, the total effect of the regulatory change would
be on ~37% of the funding mix. Hence, we expect the increased cost of bank
borrowings to affect the NIMs negatively by ~60bps.
Also, according to RBI’s draft guidelines (June 2010) loan issuers would be
required to hold loans for a minimum period of 12 months (on a maturity of up to
24 months) before being able to securitise their loans. If these guidelines are
implemented in future and were to apply to bilateral assignments also, it would
restrict the funding through assignment of receivables for MFL as the maximum
loan duration for the company is 12 months. MFL would then have to rely on
normal bank borrowings which would have higher costs attached.
Interest rates charged by MFL on gold loans range from 12% to 30% per annum
depending on the LTV with an average yield of ~19% for 8MF20Y11. Although,
currently the gold loan NBFCs are regulated by RBI, some state governments
require compliance by the NBFCs with relevant state money lending statutes. One
of the technical committees set up by RBI recently recommended that NBFCs

Muthoot Finance
|
IPO Note
A
pril 18, 2011
9
should not come under state money lender’s act, however if the state governments
have their way, it would lead to capping of interest rates which could adversely
affect the margins of MFL. The Kerala Money-Lenders Act, 1958 requires interest
rates to be capped at 2% higher than the maximum rate of interest charged by
commercial banks on loans granted by them.
The Malegam committee recently had recommended capping of interest rates at
24% for MFIs, bearing in mind that the target market for MFIs are low income
individuals or households. Gold financing NBFCs also have been subject to such
scrutiny in past and considering that most of their customers also belong to the low
income group, any future regulatory measures requiring capping of interest rates
for MFIs could also apply to gold loan financing NBFCs.
Business growth and asset quality directly linked to gold prices
One of the core drawbacks of specialized lending is that the business risk is
entirely coupled to either the specific sector or the target market. In case of
Muthoot finance the risk is entailed in the prices of collateral.
The growth for both MFL and MGF has largely been in the last 4-5 years, a period
where gold prices increased consistently. The volume growth (gold pledged) over
the FY08-8MFY11 has been 56.1% CAGR, while the Gold AUM growth over the
same period has been higher at 95.1% CAGR , implying that ~25% CAGR growth
in AUM has been due to the rise in gold prices keeping the LTV ratio constant.
Assuming, over the same period, if the volumes would have grown at the same
rate of 56.1% CAGR, but the gold prices would have declined by 25% CAGR, the
growth in AUM would have been only ~17% CAGR. Considering that higher gold
prices lead to higher pledging of gold and hence higher volumes, any significant
drop in gold prices would not only lead to decline in AUM growth rate but also a
decline in the volume growth rate. Also once the price of the collateral drops below
the loan proceeds, delinquencies would also start rising.
However, although not fully insulated, the sector has several safeguards to absorb
the impact of a sharp decline in gold prices. The loan to value ratio (LTV) for MFL
is between 60%-85% giving it a cushion against ~15% drop in gold prices.
Moreover the collateral is appraised solely based on the weight of the gold content
while the production and design costs and the costs associated with additional
gems studded into the jewelry are excluded, providing further cushion of ~5-10%
(as indicated by the management, though in our view it is unlikely that in any
auction, the lender would be able to recover anything more than the scrap value).
Another advantage which plays into the hands of the company is the emotional
quotient attached with the family jewelry that is pledged by the borrowers. The
tenure of all gold loans for MFL is 12 months, however on an average repayments
occur between 90 and 180 days. MFL also possesses the right to sell off the
collateral even before a loan becomes past due in the event the market value of
the underlying collateral becomes less than the amount outstanding on the loan.

Muthoot Finance
|
IPO Note
A
pril 18, 2011
10
Increase in competition from other players
Banks have a funding advantage versus NBFCs given the access to low-cost fixed
rate funding in the form of current account and savings account (CASA) balances.
Hence, they can afford to compete on pricing and try to take market share.
However, since ~75% of the total market is with the unorganised money lenders
and pawnshops and NBFCs are targeting customers that usually don’t have access
to bank finance or have a very urgent need, the potential offered by this sector for
organized players such as MFL is still reasonably large. However, that said, due to
the attractive ROEs currently being offered by the sector, other NBFCs have also
started entering this segment. In light of expected increase in competition, we have
factored in a drop in NIMs from 11.1% in FY2010 to 8.2% in FY2013E.
Muthoot Finance
|
IPO Note
A
pril 18, 2011
11
MFL vs. MGF
Exhibit 16: Competitive advantage analysis
MFL
MGF
Business growth
AUM growth (FY2008-9MFY2011, %) $ 93.8
115.4
Market share (FY2010, %) 19.5
6.8
Branches (9MFY2011) 2,263
1,795
Asset quality
Net NPAs (9MFY2011, %) $ 0.4
0.1
Credit cost (FY2010, %)* 0.0
0.6
CAR (9MFY2011, %) 15.2
32.5
Cost ratios
Opex to average assets (FY2010, %)* 4.1
6.2
Cost to Income ratio (FY2010, %) 43.4
66.3
Profitability ratios
NII growth (FY2008-FY2010, %) 84.1
129.7
PAT growth (FY2008-FY2010, %) 91.6
182.8
ROA (FY2010, %)* 3.5
5.1
NIM (FY2010, %)* 11.1
15.2
Valuation ratio
P/ABV (FY2013E) 1.8
1.8
Source: RHP, MGF, Bloomberg, Angel Research ; Note: $8MFY11 for MFL, * Calculated on total
assets including bilateral assignments
Exhibit 17: MFL enjoys ~3x MGF’s market share as of FY10
11.0
3.7
13.4
4.9
19.5
6.8
-
5.0
10.0
15.0
20.0
25.0
MFL MGFL
FY2007 FY2009 FY2010
(%)
Source: RHP, Angel Research
Exhibit 18: Branch growth of MGF higher than MFL
551
291
707
436
985
645
1,605
1,005
2,263
1,795
-
500
1,000
1,500
2,000
2,500
MFL MGFL
No. of branches
FY2007 FY2008 FY2009 FY2010 9MFY11
45.8% CAGR 62.4% CAGR
Source: MGF, Angel Research
Muthoot Finance
|
IPO Note
A
pril 18, 2011
12
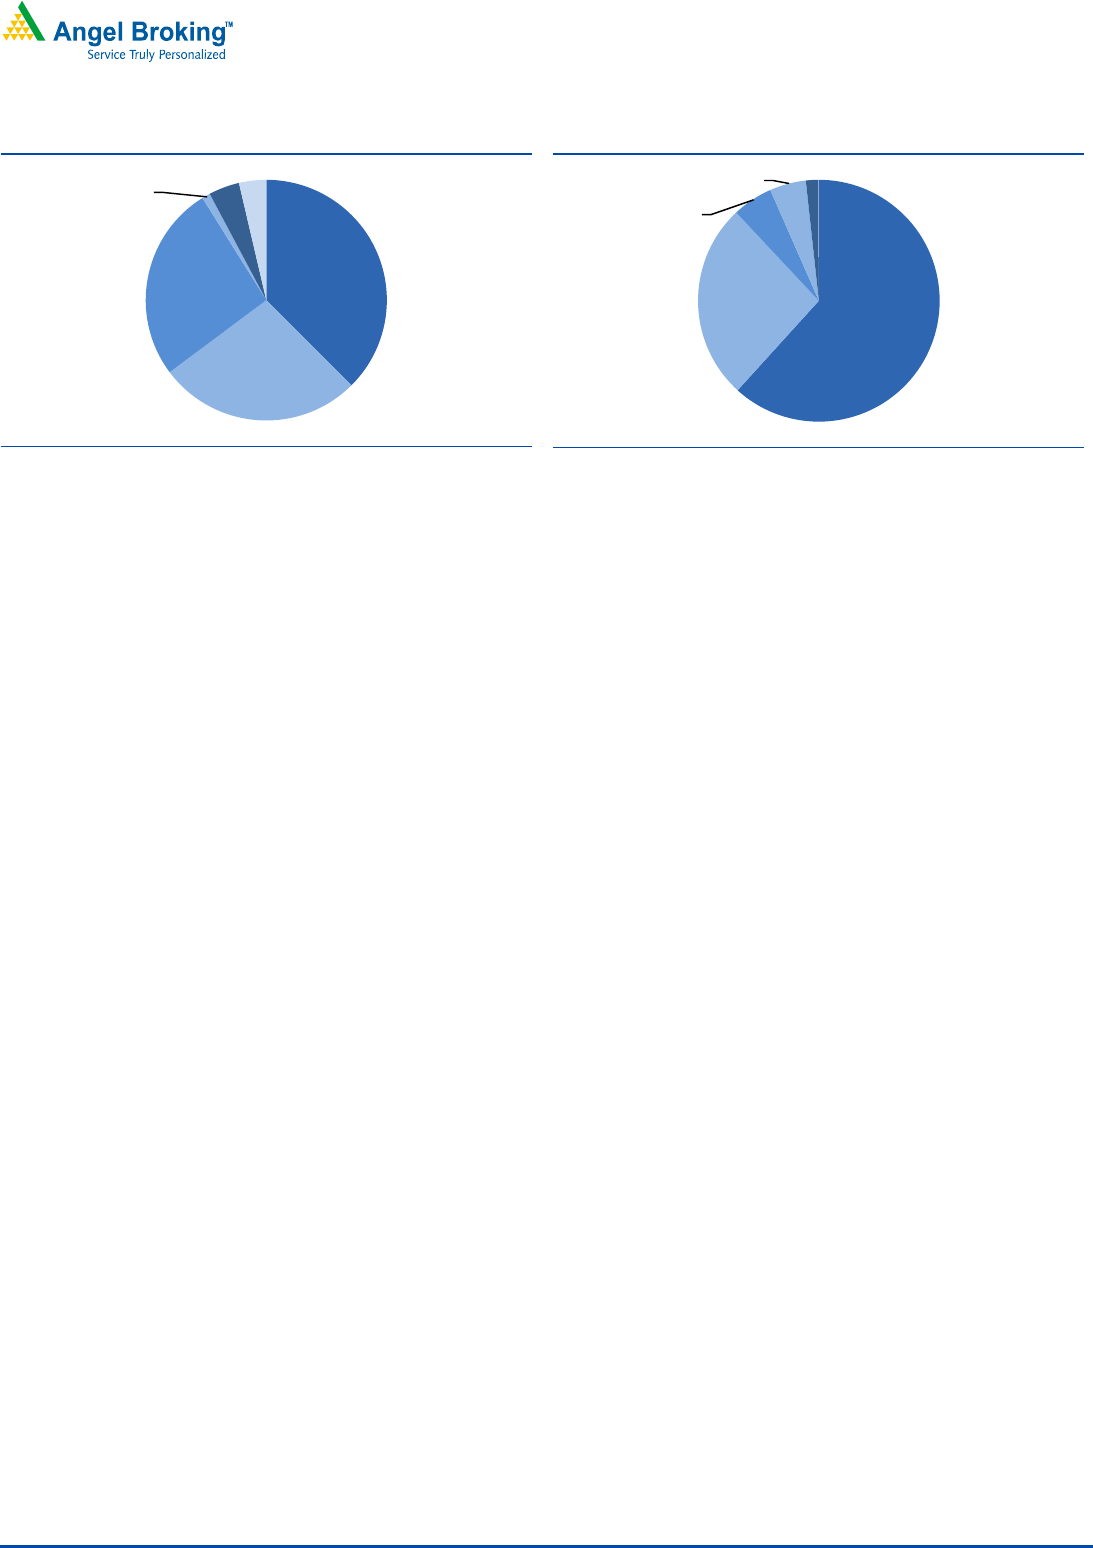
Exhibit 19: MFL – retail NCDs a stable base of funding
WC Loans
38%
NCDs
27%
Assignment
26%
Others
1%
Sub. Debt
4%
CP
4%
Source: RHP, Angel Research; Note: as of 8MFY2011
Exhibit 20: MGF – more reliance on bank funding
WC Loans
62%
Assignment
26%
NCDs
5%
Sub. Debt
5%
CP
2%
Source: MGF, Angel Research; Note: as of 9MFY2011
Outlook and valuation
While gold loan NBFCs like MFL have seen highly profitable growth so far, this has
occurred in an environment of consistently rising gold prices. Any sharp decline in
gold prices could pose downside risks to growth and asset quality. Moreover,
recent developments regarding lending to relatively low-income segments have
highlighted regulatory risks to MFL’s business from any regulatory capping of its
currently high yields (~19% in 8MFY2011). That said, post-correction, MFL’s
closest competitor Manappuram (MGF) is trading at 1.8x FY2013E BV (Bloomberg
consensus) and MFL has been priced equivalent to MGF’s valuations at the upper
end of the price band. Considering the reasonably high growth potential and
profitability, we expect moderate upsides at the upper band, also taking into
account MFL’s higher market share than MGF, better operating efficiency, higher
leverage and a more extensive pan India branch network. Hence we recommend a
Subscribe to the issue at the upper price band.
Muthoot Finance
|
IPO Note
A
pril 18, 2011
13
Income statement
Y/E March (` cr) FY07
FY08
FY09
FY10 FY11E FY12E
FY13E
Net Interest Income 124
178
296
604 1,173 1,831
2,196
- YoY Growth (%) 58.6
44.0
66.4
103.6 94.4 56.0
19.9
Other Income 10
11
14
12 14 16
19
- YoY Growth (%) 98.3
3.1
32.4
(15.8) 18.1 16.7
17.5
Operating Income 134
189
311
616 1,188 1,847
2,215
- YoY Growth (%) 61.1
40.9
64.5
98.2 92.9 55.5
19.9
Operating Expenses 67
92
162
267 447 671
839
- YoY Growth (%) 59.5
36.5
76.3
65.2 67.5 50.0
25.0
Pre - Provision Profit 67
97
149
349 740 1,176
1,376
- YoY Growth (%) 62.6
45.2
53.4
133.9 112.3 58.9
17.0
Prov. and Cont. 0
1
1
2 36 26
35
- YoY Growth (%) 70.5
821.3
(0.9)
206.3 1,598.0 (27.2)
33.7
Profit Before Tax 67
96
148
346 705 1,150
1,341
- YoY Growth (%) 62.6
44.3
53.8
133.6 103.3 63.2
16.6
Provision for Taxation
23
33
50
118 234 373
435
- as a % of PBT 34.4
34.6
34.0
34.0 33.2 32.4
32.4
PAT 44
63
98
229 471 777
906
- YoY Growth (%) 63.1
43.8
55.2
133.5 105.9 65.1
16.6
Balance sheet
Y/E March (` cr) FY07
FY08
FY09 FY10 FY11E
FY12E
FY13E
Share Capital 5
5
49 301 320
372
372
Reserve & Surplus 154
208
312 283 990
2,574
3,415
Net Borrowings 1,383
1,915
3,166 5,281 12,001
17,416
23,523
- Growth (%) 71.6
38.5
65.3 66.8 127.3
45.1
35.1
Other Liabilities & Provisions 67
156
231 572 1,055
1,268
1,691
Total Liabilities 1,609
2,285
3,758 6,436 14,366
21,630
29,000
Investments 24
18
9 8 8
8
8
Gross Advances (AUM) 1,470
2,238
3,385 7,466 16,053
23,276
30,259
less : Assignment of receivables
81
434
813 2,008 3,670
4,524
4,998
Net Advances 1,389
1,804
2,572 5,458 12,382
18,753
25,261
- Growth (%) 74.8
29.9
42.6 112.2 126.9
51.4
34.7
Fixed Assets 63
109
129 153 271
392
510
Other Assets 132
354
1,049 818 1,706
2,477
3,222
Total Assets 1,609
2,285
3,758 6,436 14,366
21,630
29,000
- Growth (%) 71.1
42.0
64.5 71.3 123.2
50.6
34.1
]
Muthoot Finance
|
IPO Note
A
pril 18, 2011
14
Ratio Analysis
Y/E March FY07
FY08
FY09 FY10 FY11E
FY12E
FY13E
Profitability ratios (%)
NIMs* 10.9
9.6
10.5 11.1 10.0
9.3
8.2
Cost to Income Ratio 50.1
48.6
52.0 43.4 37.7
36.3
37.9
RoA* 3.3
2.9
2.7 3.5 3.6
3.5
3.0
RoE 35.1
33.9
34.1 48.3 49.7
36.5
26.9
B/S ratios (%)
AUM/ Gross borrowing 100.4
95.3
85.1 102.4 102.4
106.1
106.1
CAR 13.1
12.6
16.3 14.8 15.1
20.8
20.5
- Tier I 10.5
10.6
12.5 9.9 11.1
16.5
15.7
Asset Quality (%)
Gross NPAs* 0.2
0.4
0.5 0.5 0.5
0.5
0.6
Net NPAs* 0.1
0.4
0.4 0.4 0.4
0.5
0.5
Loan Loss Prov./Avg. Assets*
0.0
0.0
0.0 0.0 0.0
0.0
0.1
Provision Coverage 10.0
10.0
10.0 10.8 11.0
15.0
20.0
Per Share Data (`)
EPS 2.0
2.9
3.9 7.6 14.7
20.9
24.4
ABVPS (75% cover. NPAs) 4.6
6.7
7.1 10.2 18.7
39.4
77.2
DPS -
-
- - -
1.0
1.5
Valuation Ratios
#
PER (x)
86.2
59.9
45.1 23.1 11.9
8.4
7.2
P/ABVPS (x)
26.3
24.7
17.2 9.4 4.4
2.3
1.8
Dividend Yield -
-
- - -
0.6
0.9
DuPont Analysis (%) *
NII 9.4
8.1
8.1 9.3 8.9
8.3
7.3
(-) Prov. Exp. 0.0
0.0
0.0 0.0 0.3
0.1
0.1
Adj NII 9.4
8.0
8.1 9.2 8.6
8.2
7.2
Other Inc. 0.8
0.5
0.4 0.2 0.1
0.1
0.1
Op. Inc. 10.2
8.5
8.5 9.4 8.7
8.2
7.2
Opex 5.1
4.2
4.4 4.1 3.4
3.0
2.8
PBT 5.1
4.4
4.1 5.3 5.3
5.2
4.5
Taxes 1.7
1.5
1.4 1.8 1.8
1.7
1.4
ROA 3.3
2.9
2.7 3.5 3.6
3.5
3.0
Leverage 10.5
11.8
12.7 13.8 14.0
10.4
8.9
ROE 35.1
33.9
34.1 48.3 49.7
36.5
26.9
Note;
#
Valuations at the upper price band, * Calculated on total assets including bilateral assignments

Muthoot Finance
|
IPO Note
A
pril 18, 2011
15
Research Team Tel: 022 - 39357800 E-mail: [email protected] Website: www.angelbroking.com
DISCLAIMER
This document is solely for the personal information of the recipient, and must not be singularly used as the basis of any investment
decision. Nothing in this document should be construed as investment or financial advice. Each recipient of this document should make
such investigations as they deem necessary to arrive at an independent evaluation of an investment in the securities of the companies
referred to in this document (including the merits and risks involved), and should consult their own advisors to determine the merits and
risks of such an investment.
Angel Broking Limited, its affiliates, directors, its proprietary trading and investment businesses may, from time to time, make
investment decisions that are inconsistent with or contradictory to the recommendations expressed herein. The views contained in this
document are those of the analyst, and the company may or may not subscribe to all the views expressed within.
Reports based on technical and derivative analysis center on studying charts of a stock's price movement, outstanding positions and
trading volume, as opposed to focusing on a company's fundamentals and, as such, may not match with a report on a company's
fundamentals.
The information in this document has been printed on the basis of publicly available information, internal data and other reliable
sources believed to be true, but we do not represent that it is accurate or complete and it should not be relied on as such, as this
document is for general guidance only. Angel Broking Limited or any of its affiliates/ group companies shall not be in any way
responsible for any loss or damage that may arise to any person from any inadvertent error in the information contained in this report
.
Angel Broking Limited has not independently verified all the information contained within this document. Accordingly, we cannot testify,
nor make any representation or warranty, express or implied, to the accuracy, contents or data contained within this document. While
Angel Broking Limited endeavours to update on a reasonable basis the information discussed in this material, there may be regulatory,
compliance, or other reasons that prevent us from doing so.
This document is being supplied to you solely for your information, and its contents, information or data may not be reproduced,
redistributed or passed on, directly or indirectly.
Angel Broking Limited and its affiliates may seek to provide or have engaged in providing corporate finance, investment banking or
other advisory services in a merger or specific transaction to the companies referred to in this report, as on the date of this report or in
the past.
Neither Angel Broking Limited, nor its directors, employees or affiliates shall be liable for any loss or damage that may arise from or in
connection with the use of this information.
Note: Please refer to the important `Stock Holding Disclosure' report on the Angel website (Research Section). Also, please refer to the
latest update on respective stocks for the disclosure status in respect of those stocks. Angel Broking Limited and its affiliates may have
investment positions in the stocks recommended in this report.